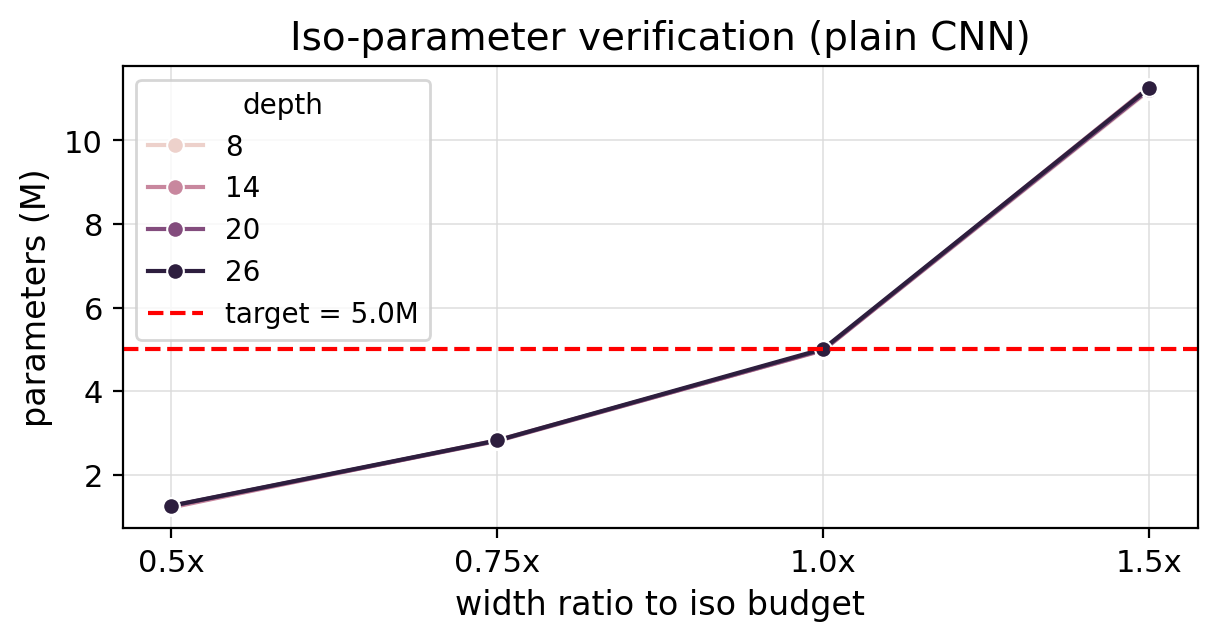
Iso-parameter verification
Budget matching across the plain CNN grid.
A controlled diagnostic of how plain CNNs trade depth for width when parameter count, optimizer protocol, training budget, and SGD noise scale are held fixed.
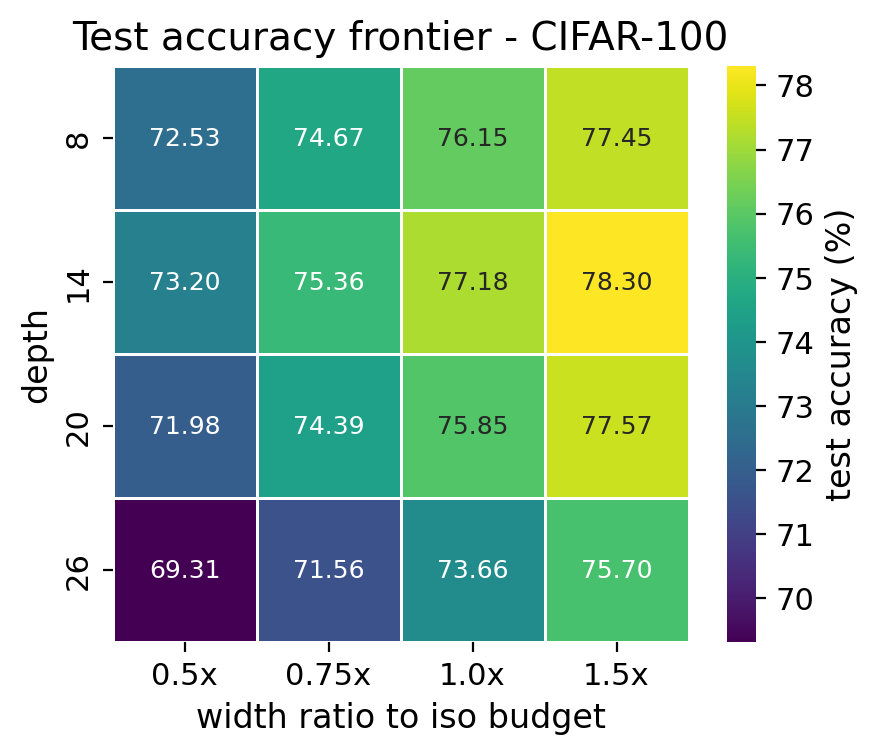
Fixed-budget frontier
The 1.0x column keeps the parameter budget near 5M while depth changes. D=14 is the strongest iso-parameter row on both CIFAR tasks, with D=20 close on CIFAR-10.
Width-ratio cells are local off-budget checks around each iso width. The fixed-budget claim comes from the 1.0x column.
Extra width helps within each row, but the iso-budget column answers a different question. At the same target budget, extra plain depth eventually trades away too much trainability.
Dataset comparison
CIFAR-10 shows a D=14 and D=20 plateau above D=8 and D=26. CIFAR-100 shows a clearer peak at D=14 and a larger deep-plain drop.
The table reports three-seed means from the plain CNN iso row. Accuracy and gap are percentages.
| Dataset | Depth | Width | Params | Accuracy | Gap |
|---|
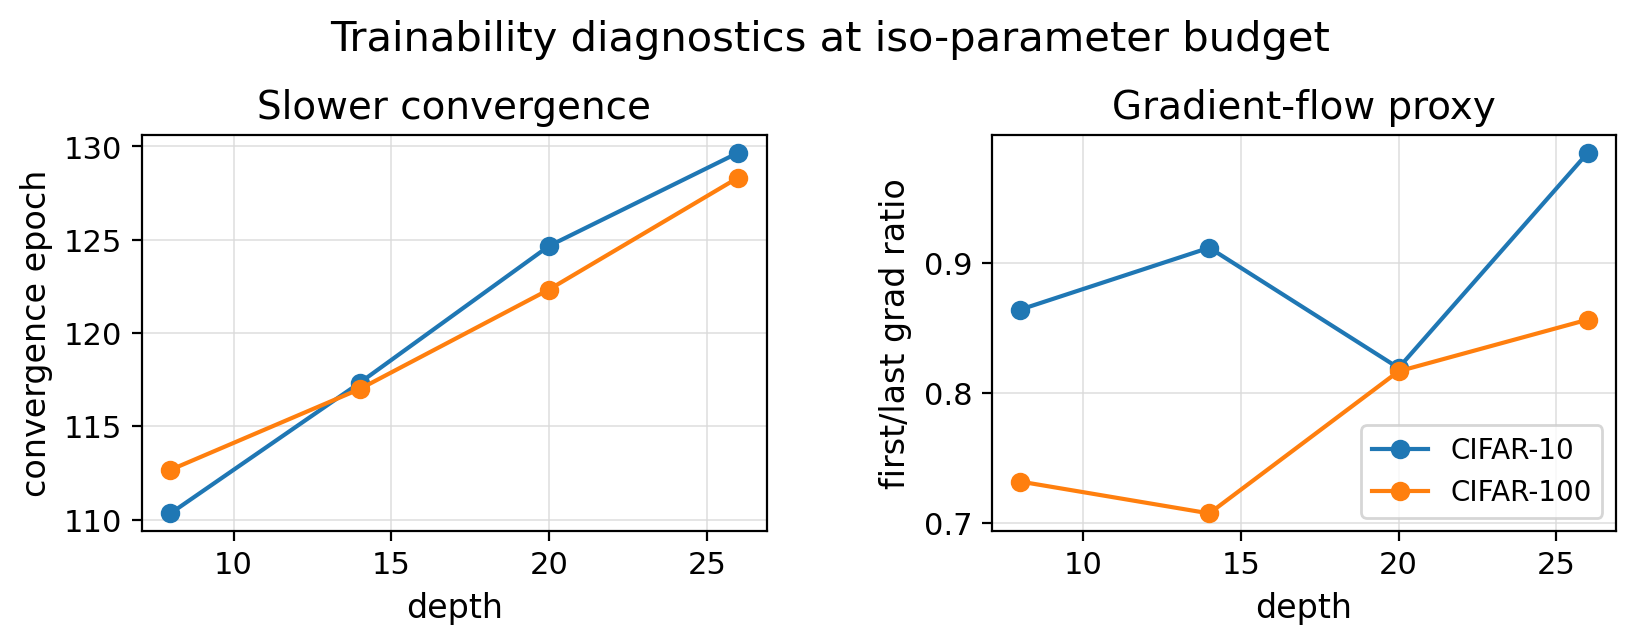
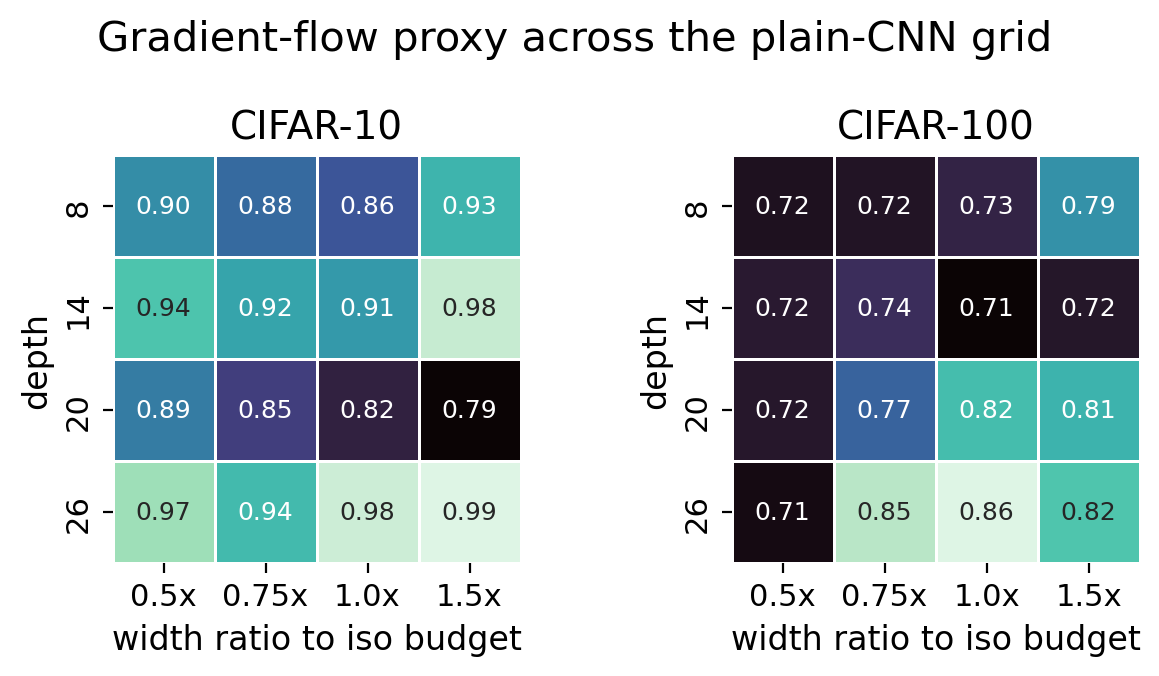
Gradient and trainability diagnostics
Convergence epoch rises monotonically with depth at the iso budget. The gradient-ratio proxy does not collapse in a simple way, so the diagnosis is broader than one vanishing-gradient symptom.
Convergence is the epoch where online train accuracy reaches 99% of its own final value.
The deepest plain endpoint has the slowest convergence and the weakest CIFAR-100 accuracy at the matched parameter budget.
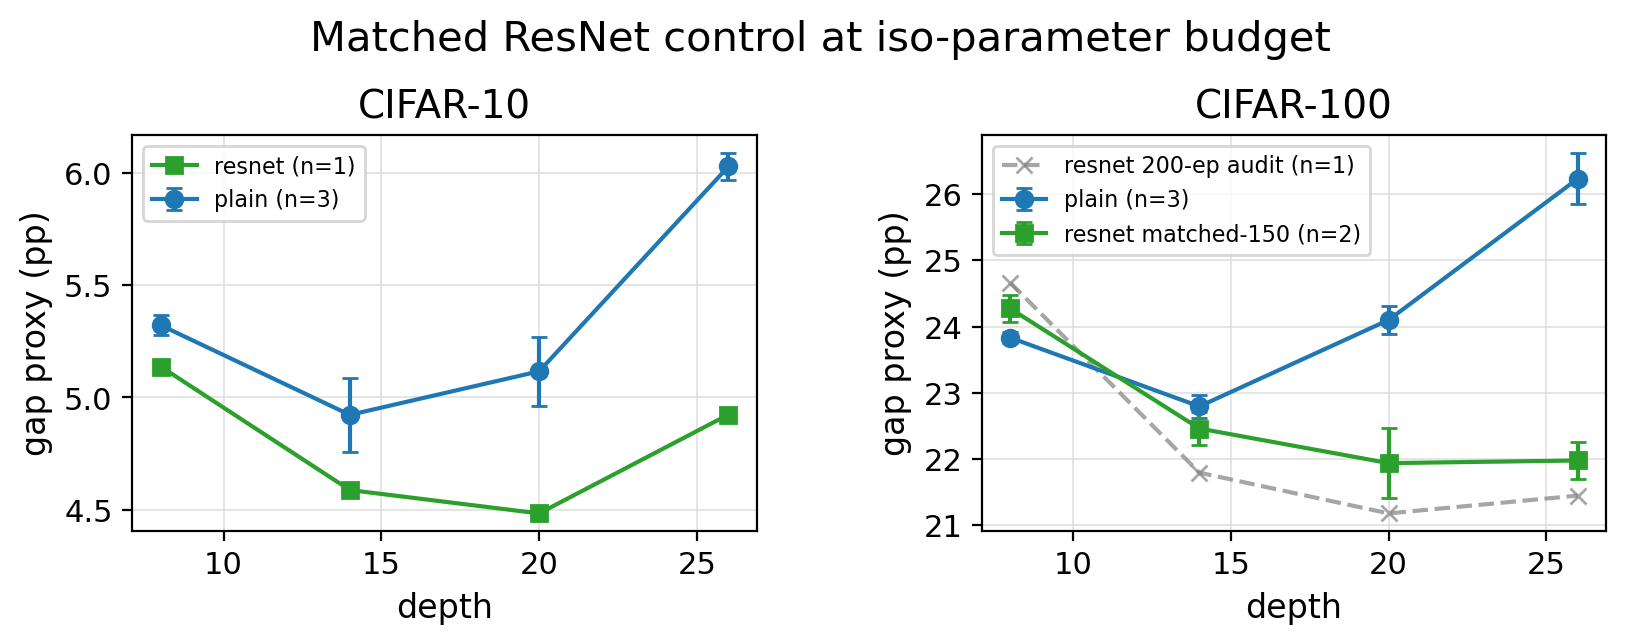
Mechanism checks
Residual pathways recover the deep endpoint, which supports a trainability account. Extra width rescues the shallow endpoint, but the recovery is parameter-expensive.
ResNet controls are diagnostic interventions, not a fully powered architecture benchmark.
Fixed optimizer protocol
All plain-grid runs share the same learning rate, batch size, momentum, data size, and scalar noise-scale value. Gap variation therefore cannot be reduced to the scalar g value alone.
Fixed value: g = eta N / B(1 - beta) = 390.625 for every plain-grid run.
The fixed protocol blocks a common confound: different architectures are not being handed different optimizer noise states. Remaining variation points back to architecture, optimization dynamics, and their interaction.
Paper figure set
The interactive views above are generated from the same committed aggregate data used by the paper figures.
The report keeps only the six public figures used here.
Budget matching across the plain CNN grid.
The clearest D=14 peak in the frontier.
Convergence slows as plain depth rises.
Residual pathways recover the deep endpoint.
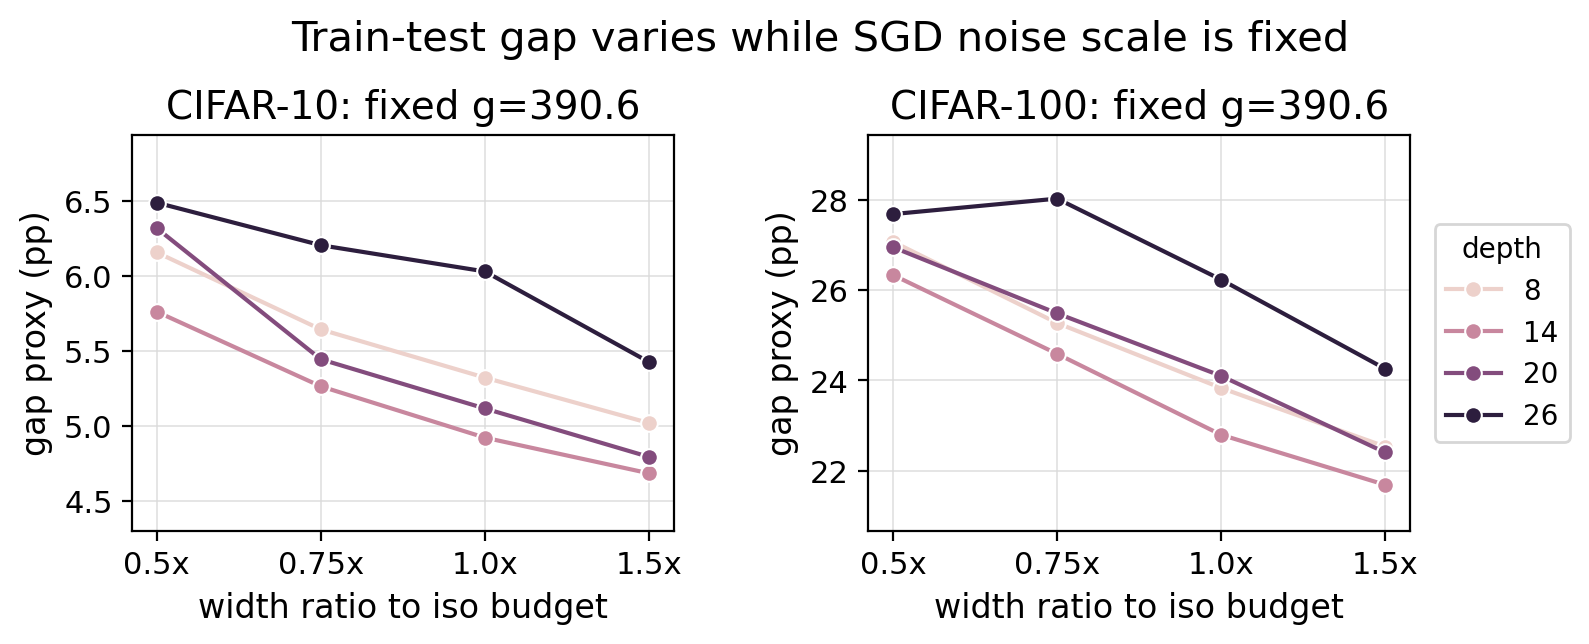
Gap variation remains at fixed scalar g.
The deep penalty is broader than one simple collapse.
Audit trail
The report uses curated aggregate outputs and source text already present in the repository. No expensive experiments were regenerated.
Run `python scripts/build_report_data.py` after updating CSV summaries.